(No I'm not a Greenie. 30% Tax Credit, $5,210 Rebate, and <10 yr ROI are my only reasons)
Installed: April
12, 2010
DC Rating: 5,600 kW
AC Rating: 4,760 kW
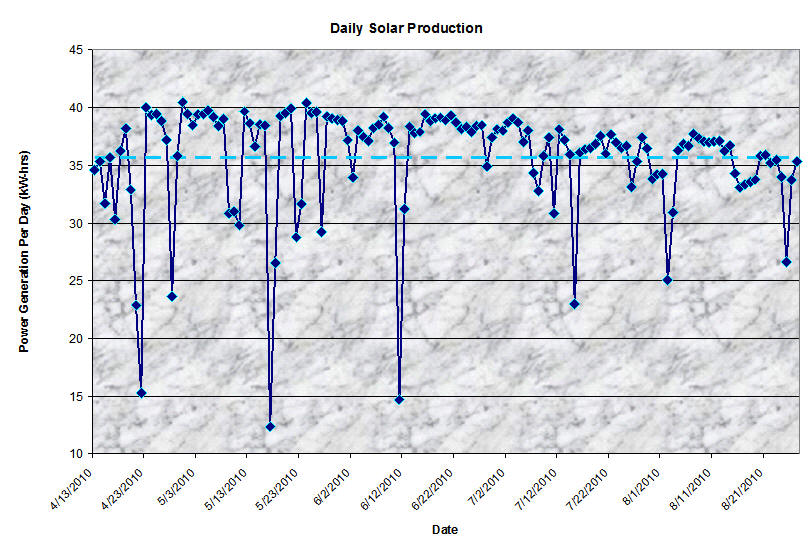
Only Geeks check their
Power Production Online!
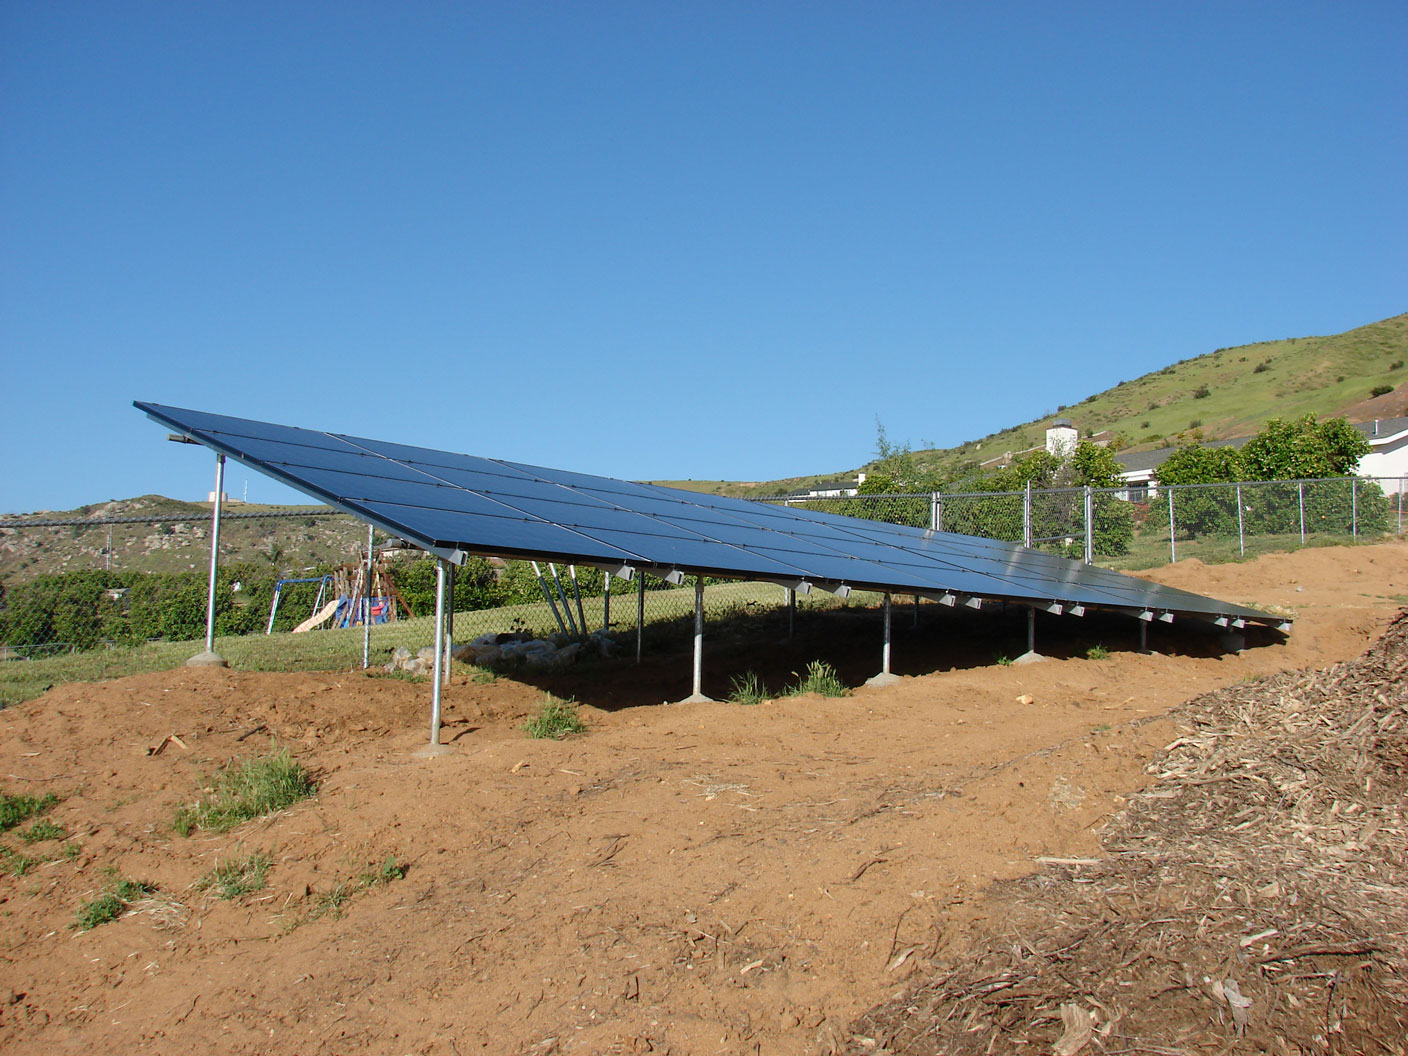
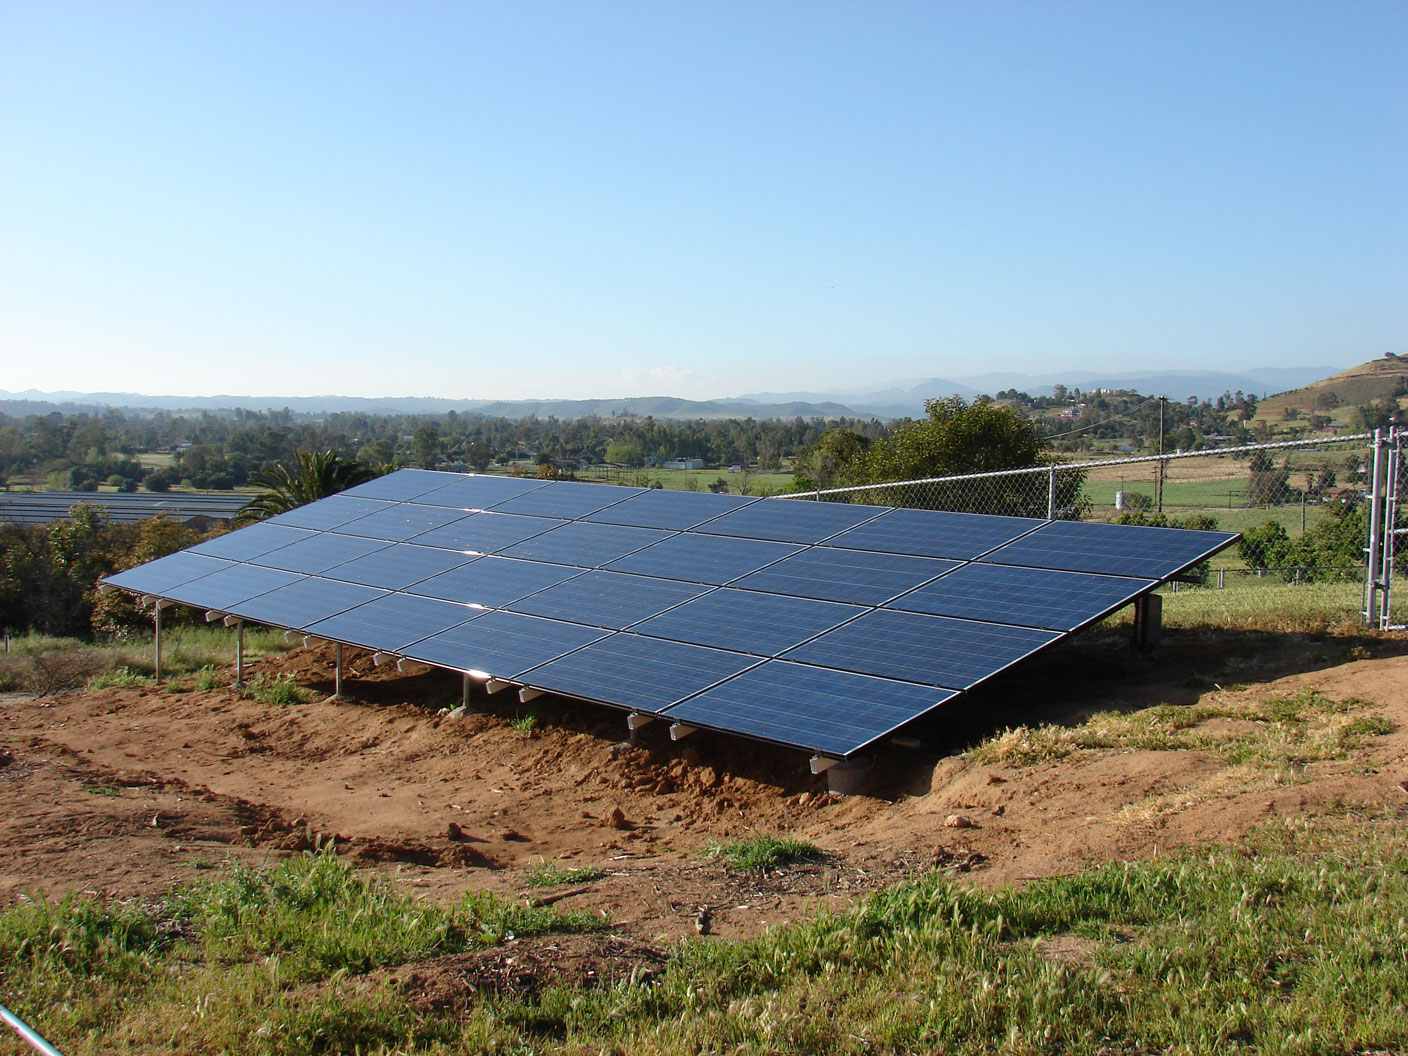
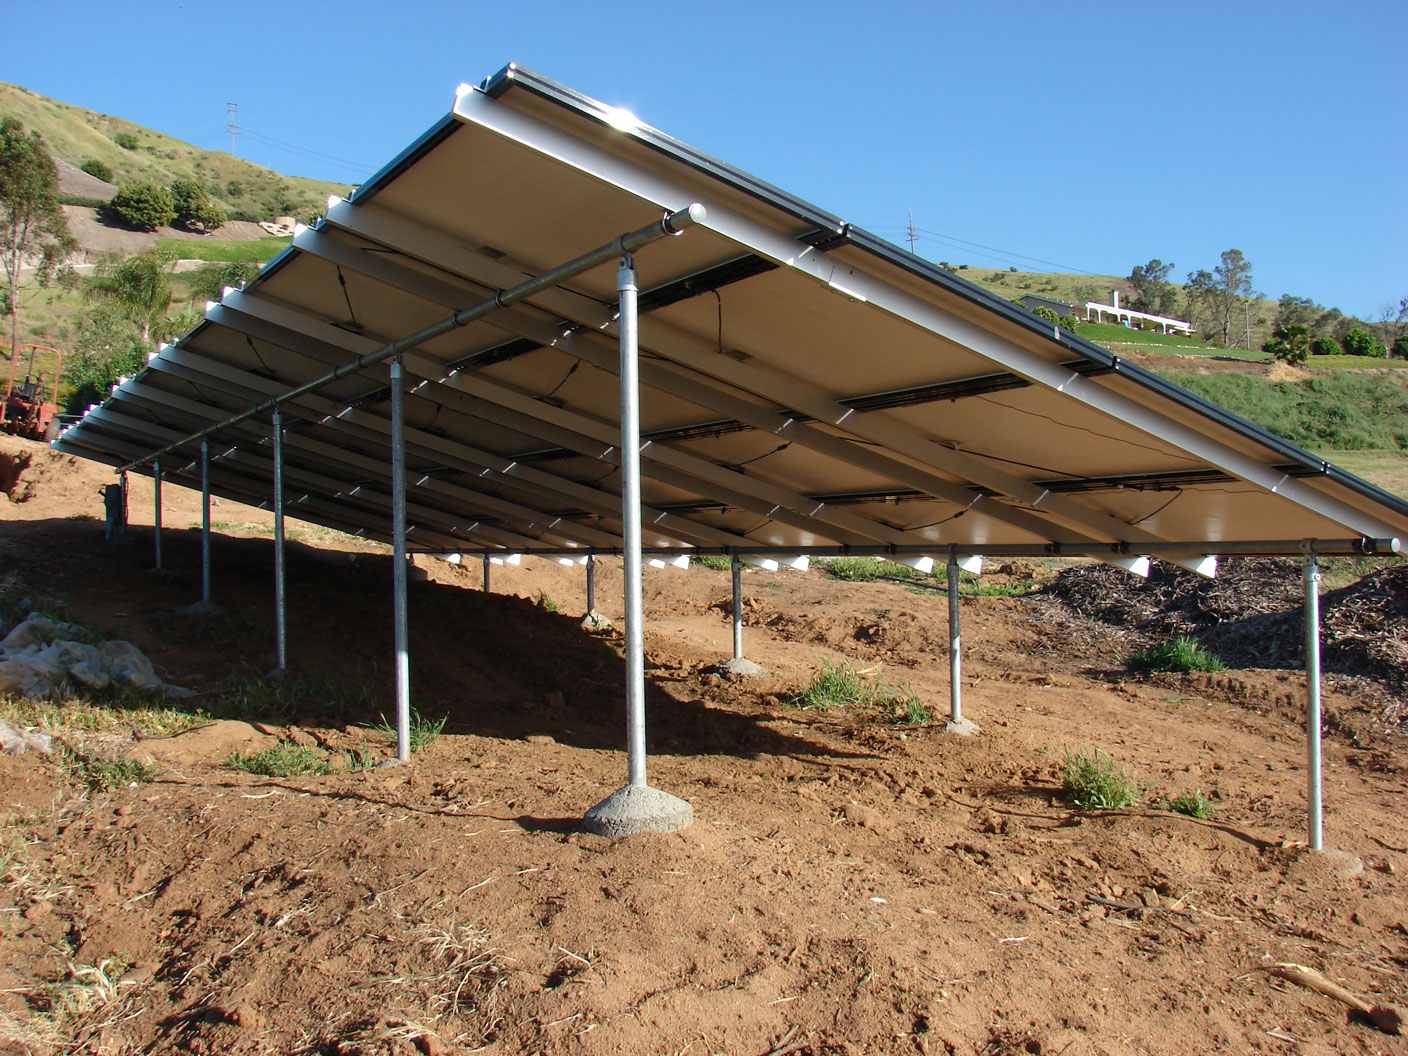
Pictures
|
|
|
|
|
|
| Dauben Solar Tracking | ||||||||||||
| SDGE Power Bills | Solar Radiation | Calculated Monthly Solar Power (kW-hrs) | Solar Savings1 | Projected Monthly Power Produced2 (kW-hrs) | Actual Monthly Power Produced2 (kW-hrs) | Actual Power Consumed (kW-hrs) | Power Usage Versus Last Year (kW-hrs) | |||||
| Statement Date | Bill Days | SDGE Charges | Monthly Power from SDGE KW-hr | Cost/Kw-Hr | Avg KW-hr/day | kW-hr/m2/day | ||||||
| 1/15/2009 | 8 | $29.31 | 108 | $0.27 | 13.5 | 4.64 | 152.0 | $41.26 | 207.3 | |||
| 2/17/2009 | 29 | $67.63 | 465 | $0.15 | 16.0 | 5.09 | 592.0 | $86.10 | 807.3 | |||
| 3/18/2009 | 32 | $77.83 | 523 | $0.15 | 16.3 | 5.7 | 695.5 | $103.51 | 948.5 | |||
| 4/15/2009 | 29 | $122.13 | 645 | $0.19 | 22.2 | 6.19 | 694.6 | $131.52 | 947.2 | |||
| 5/15/2009 | 30 | $199.55 | 889 | $0.22 | 29.6 | 6.57 | 771.1 | $173.09 | 1051.5 | |||
| 6/16/2009 | 32 | $215.30 | 951 | $0.23 | 29.7 | 6.45 | 839.3 | $190.01 | 1144.5 | |||
| 7/16/2009 | 30 | $227.28 | 967 | $0.24 | 32.2 | 6.74 | 797.1 | $187.35 | 1087.0 | |||
| 8/14/2009 | 29 | $377.52 | 1404 | $0.27 | 48.4 | 6.83 | 792.7 | $213.16 | 1081.0 | |||
| 9/15/2009 | 32 | $437.54 | 1,619 | $0.27 | 50.6 | 6.4 | 852.8 | $230.48 | 1163.0 | |||
| 10/14/2009 | 29 | $203.42 | 1,011 | $0.20 | 34.9 | 5.62 | 702.2 | $141.29 | 957.5 | |||
| 11/13/2009 | 30 | $154.65 | 758 | $0.20 | 25.3 | 5.03 | 643.6 | $131.31 | 877.7 | |||
| 12/15/2009 | 32 | $159.00 | 723 | $0.22 | 22.6 | 4.39 | 607.2 | $133.54 | 828.0 | |||
| 1/15/2010 | 31 | $126.30 | 681 | $0.19 | 22.0 | 4.64 | 589.1 | $109.26 | 803.3 | |||
| 2/12/2010 | 28 | $80.59 | 497 | $0.16 | 17.8 | 5.09 | 571.6 | $92.68 | 779.4 | |||
| 3/16/2010 | 32 | $93.22 | 565 | $0.16 | 17.7 | 5.7 | 695.5 | $114.76 | 948.5 | |||
| 4/14/2010 | 29 | $71.64 | 463 | $0.15 | 16.0 | 6.19 | 694.6 | $107.47 | 947.2 | |||
| 4/12/2010 | Solar Operational | |||||||||||
| 5/14/2010 | 32 | $5.10 | -444 | $0.00 | -13.9 | 6.57 | 822.5 | $154.39 | 1131.81 | 688 | -201 | |
| 6/15/2010 | 32 | $5.44 | -122 | $0.00 | -3.8 | 6.45 | 839.3 | $229.18 | 1134.33 | 1,012 | 61 | |
| 7/15/2010 | 30 | $5.10 | -22 | $0.00 | -0.7 | 6.74 | 797.1 | $255.69 | 1109.88 | 1,088 | 121 | |
| 8/13/2010 | 29 | $5.10 | -5 | $0.00 | -0.2 | 6.83 | 792.7 | $277.50 | 1037.04 | 1,032 | -372 | |
| Totals Since Installation | 123 | $20.74 | -593 | 5.80 | 24,156.1 | $916.77 | 4,413.1 | 3,820.1 | ||||
| Projected ROI = | 6.41 | Years | ||||||||||
| 1 - Actual savings is greater since solar reduces what is paid to SDGE's higher tiers. Solar savings is based on KW-hr rate from Cost/Kw-Hr rate from previous year. | ||||||||||||
| 2 - Power generation is much greater than calculated value contracted for. | ||||||||||||